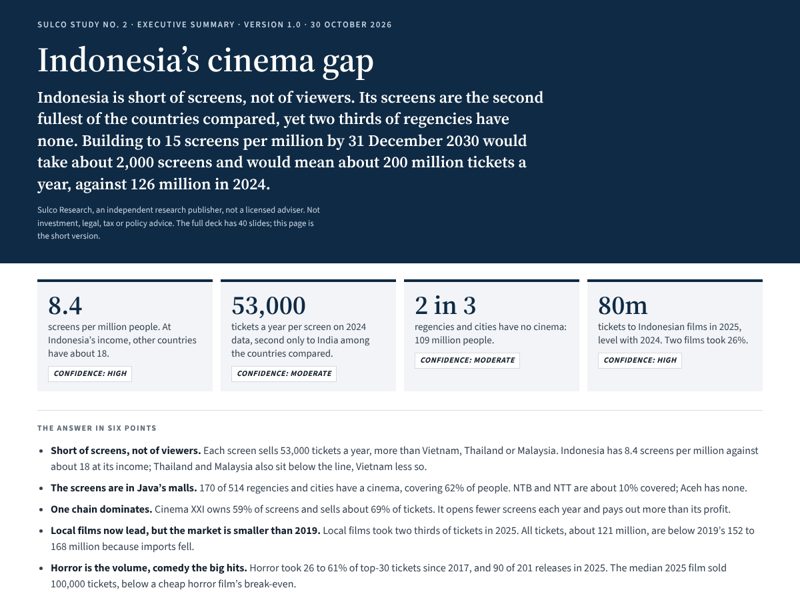
Key numbers
Confidence (Sulco judgement) is shown on each number. Overall finding: moderate. Version 1.0, 30 Oct 2026; every number here appears once on the Canonical sheet of the study workbook with its source and grade.
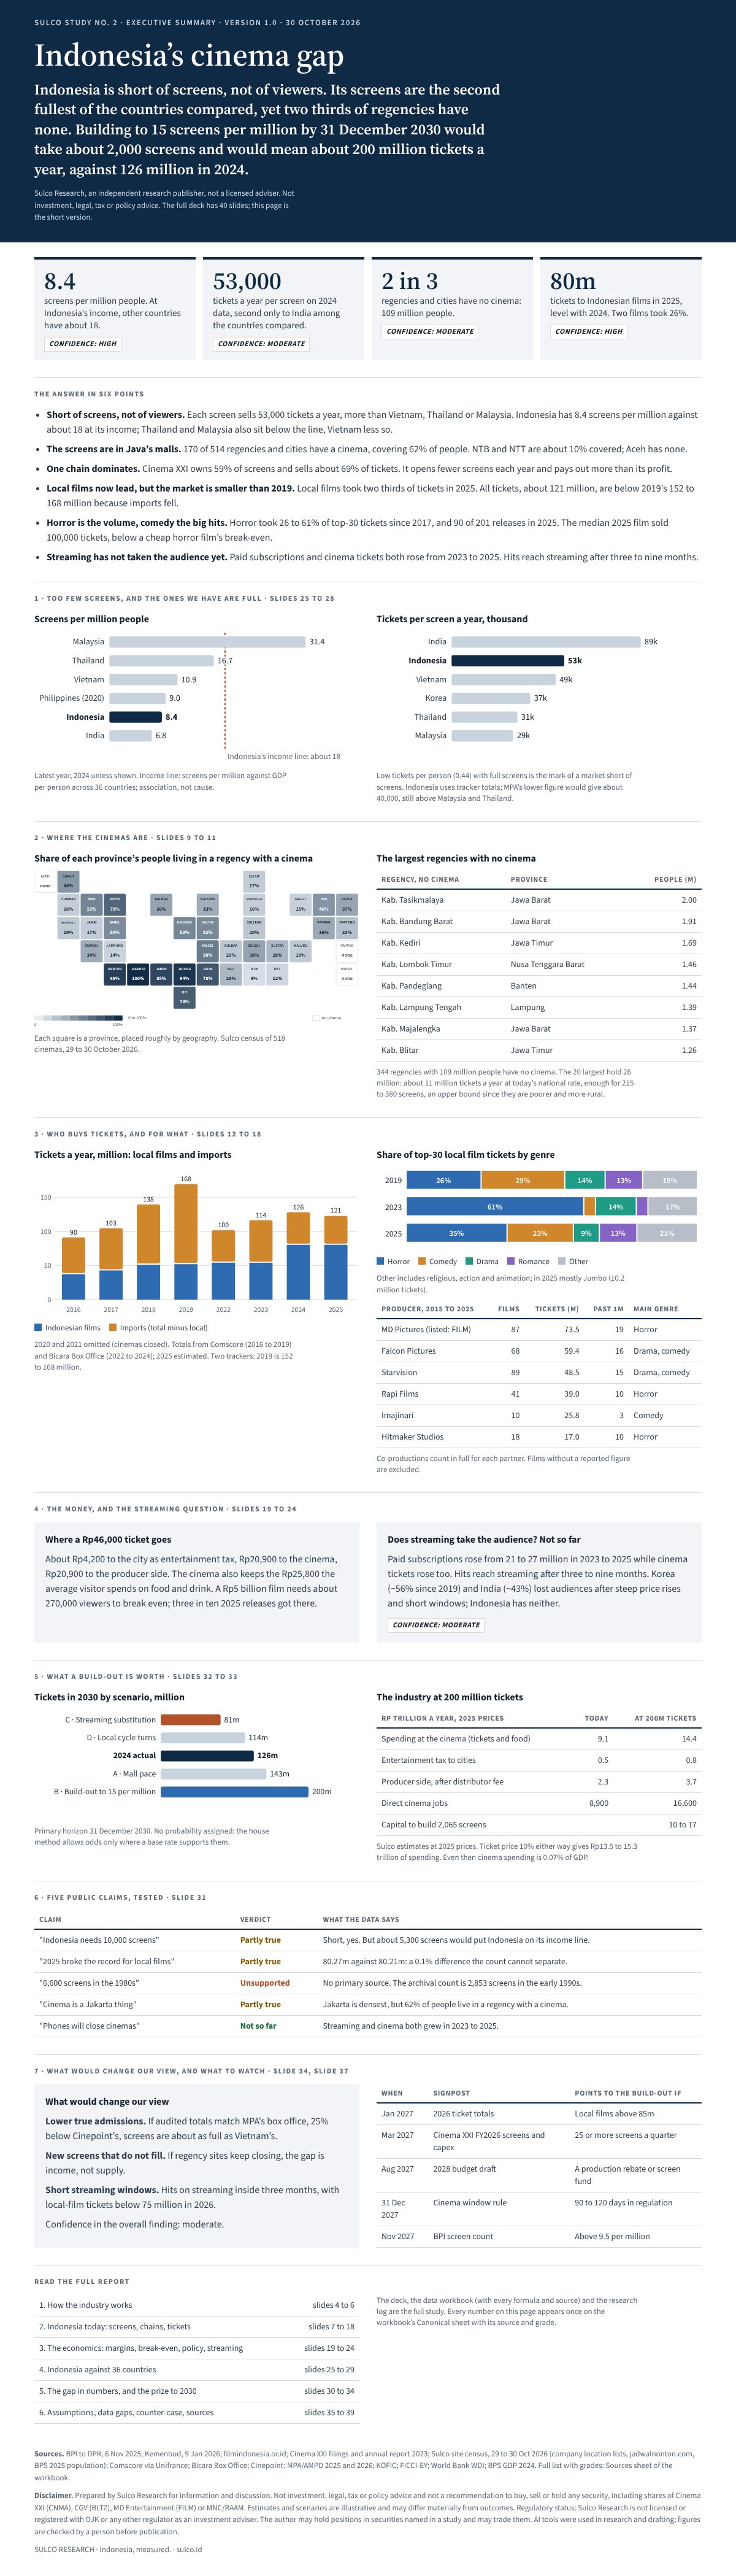
The answer in six points
- Short of screens, not of viewers. Each screen sells 53,000 tickets a year, more than Vietnam, Thailand or Malaysia. Indonesia has 8.4 screens per million against about 18 at its income; Thailand and Malaysia also sit below the line, Vietnam less so.
- The screens are in Java’s malls. 170 of 514 regencies and cities have a cinema, covering 62% of people. NTB and NTT are about 10% covered; Aceh has none.
- One chain dominates. Cinema XXI owns 59% of screens and sells about 69% of tickets. It opens fewer screens each year and pays out more than its profit.
- Local films now lead, but the market is smaller than 2019. Local films took two thirds of tickets in 2025. All tickets, about 121 million, are below 2019’s 152 to 168 million because imports fell.
- Horror is the volume, comedy the big hits. Horror took 26 to 61% of top-30 tickets since 2017, and 90 of 201 releases in 2025. The median 2025 film sold 100,000 tickets, below a cheap horror film’s break-even.
- Streaming has not taken the audience yet. Paid subscriptions and cinema tickets both rose from 2023 to 2025. Hits reach streaming after three to nine months.
1Too few screens, and the ones we have are full
Slides 25 to 28Indonesia has 8.4 screens per million against about 18 at its income, and each screen sells 53,000 tickets a year
Screens per million people
Dashed line: Indonesia’s income line, about 18 screens per million
Tickets per screen a year, thousand
Low tickets per person (0.44) with full screens is the mark of a market short of screens. Indonesians go to the cinema about as often as their income predicts, on half the screens.
2Where the cinemas are
Slides 9 to 11170 of 514 regencies and cities have a cinema, covering 62% of people; Java is 74 to 100% covered, NTB and NTT about 10%
Share of each province’s people living in a regency with a cinema
All Indonesia
- People covered
- 62%
- Regencies with a cinema
- 170 of 514
- Cinemas found
- 518
- People with none, m
- 109.1
Largest regencies with no cinema
- Kab. Tasikmalaya, Jawa Barat 2.00m
- Kab. Bandung Barat, Jawa Barat 1.91m
- Kab. Kediri, Jawa Timur 1.69m
The largest regencies with no cinema
| Regency, no cinema | Province | People (m) |
|---|---|---|
| Kab. Tasikmalaya | Jawa Barat | 2.00 |
| Kab. Bandung Barat | Jawa Barat | 1.91 |
| Kab. Kediri | Jawa Timur | 1.69 |
| Kab. Lombok Timur | Nusa Tenggara Barat | 1.46 |
| Kab. Pandeglang | Banten | 1.44 |
| Kab. Lampung Tengah | Lampung | 1.39 |
| Kab. Majalengka | Jawa Barat | 1.37 |
| Kab. Blitar | Jawa Timur | 1.26 |
344 regencies with 109 million people have no cinema. The 20 largest hold 26 million: about 11 million tickets a year at today’s national rate, enough for 215 to 380 screens, an upper bound since they are poorer and more rural.
“Covered” means living in a regency or city with at least one cinema; it does not mean every resident lives near one. Coverage is by address, not travel time.
The screens are in Java’s malls. Cinema XXI owns 59% of screens and sells about 69% of tickets; it opens fewer screens each year and pays out more than its profit.
3Who buys tickets, and for what
Slides 12 to 18Local films took two thirds of tickets in 2025, but the whole market, about 121 million tickets, is still below 2019
Tickets a year, million: local films and imports
Indonesian filmsImports (total minus local)
Share of top-30 local film tickets by genre
HorrorComedyDramaRomanceOther
The largest producers by tickets sold
| Producer, 2015 to 2025 | Films | Tickets (m) | Past 1m | Main genre |
|---|---|---|---|---|
| MD Pictures (listed: FILM) | 87 | 73.5 | 19 | Horror |
| Falcon Pictures | 68 | 59.4 | 16 | Drama, comedy |
| Starvision | 89 | 48.5 | 15 | Drama, comedy |
| Rapi Films | 41 | 39.0 | 10 | Horror |
| Imajinari | 10 | 25.8 | 3 | Comedy |
| Hitmaker Studios | 18 | 17.0 | 10 | Horror |
Co-productions count in full for each partner. Films without a reported figure are excluded. About 110 to 140 companies release a film each year, three quarters of them only one.
Horror is the volume, comedy the big hits. Horror took 26 to 61% of top-30 tickets since 2017 and 90 of 201 releases in 2025; the median 2025 film sold 100,000 tickets, below a cheap horror film’s break-even.
4The money, and the streaming question
Slides 19 to 24The cinema keeps about half of each ticket and all of the popcorn; streaming has grown alongside cinema, not instead of it
Where a Rp46,000 ticket goes
City (entertainment tax)CinemaProducer side
Second bar, same scale: what the average visitor spends on food and drink, all kept by the cinema.
About Rp4,200 goes to the city as entertainment tax, Rp20,900 to the cinema and Rp20,900 to the producer side. A Rp5 billion film needs about 270,000 viewers to break even; three in ten 2025 releases got there.
Does streaming take the audience? Not so far
Cinema visits since 2019
Korea and India lost audiences after steep price rises and short windows; Indonesia has neither.
Confidence: moderateA ticket splits evenly between the cinema and the producer side after the city’s tax, and the cinema makes more on food and drink than on its share of the ticket.
5What a build-out is worth
Slides 32 to 33Four paths to 31 December 2030 give 81 to 200 million tickets a year; only a build-out to 15 screens per million reaches 200 million
Select a path. Each shows screens, tickets and box office in 2030 at 2025 prices. Primary horizon 31 December 2030. No probability is assigned: the house method allows odds only where a base rate supports them, and three growth stories are not a reference class.
Bar = tickets in 2030; dashed line = 126 million, 2024. Screens, screens per million and box office (Rp trillion, 2025 prices) in the columns.
A · Mall pace
Screens keep growing 2.5% a year with new malls; each screen still sells about 53,000 tickets.
- Tickets 2030
- 143m
- Per person
- 0.48
- Screens
- 2,690 (9.1 per million)
- Box office
- Rp6.6 tn
No probability assigned.
The industry at 200 million tickets
| Rp trillion a year, 2025 prices | Today | At 200m tickets |
|---|---|---|
| Spending at the cinema (tickets and food) | 9.1 | 14.4 |
| Entertainment tax to cities | 0.5 | 0.8 |
| Producer side, after distributor fee | 2.3 | 3.7 |
| Direct cinema jobs | 8,900 | 16,600 |
| Capital to build 2,065 screens | 10 to 17 |
Sulco estimates at 2025 prices. Ticket price 10% either way gives Rp13.5 to 15.3 trillion of spending. Even then cinema spending is 0.07% of GDP. Capital assumes Rp5 to 8 billion a screen; small formats would cost less.
Building to 15 screens per million takes about 2,065 more screens and Rp10 to 17 trillion of capital, and would lift spending at the cinema from Rp9.1 trillion to Rp14.4 trillion a year.
6Five public claims, tested
Slide 31Indonesia is short of screens but not by 10,000, the 2025 record is a tie, and streaming has not hurt cinema yet
“Indonesia needs 10,000 screens”
Partly true
Short, yes. But about 5,300 screens would put Indonesia on its income line.
“2025 broke the record for local films”
Partly true
80.27m against 80.21m: a 0.1% difference the count cannot separate.
“6,600 screens in the 1980s”
Unsupported
No primary source. The archival count is 2,853 screens in the early 1990s.
“Cinema is a Jakarta thing”
Partly true
Jakarta is densest, but 62% of people live in a regency with a cinema.
“Phones will close cinemas”
Not so far
Streaming and cinema both grew in 2023 to 2025.
Each claim is checked against the best available count. Where the count cannot separate two numbers, we say so rather than call a record.
7What would change our view, and what to watch
Slide 34, Slide 37The 2026 ticket totals in January 2027 are the first test of which path Indonesia is on
What would change our view
Confidence in the overall finding: moderate. The full study sets out the strongest case against our reading.
Dated signposts
2026 ticket totalsPoints to the build-out if: Local films above 85m
Cinema XXI FY2026 screens and capexPoints to the build-out if: 25 or more screens a quarter
2028 budget draftPoints to the build-out if: A production rebate or screen fund
Cinema window rulePoints to the build-out if: 90 to 120 days in regulation
BPI screen countPoints to the build-out if: Above 9.5 per million
The full study lists eight signposts; the five with the clearest thresholds are shown here.
If local films pass 85 million tickets in 2026 and Cinema XXI adds 25 or more screens a quarter, the build-out path is under way. If not, the mall pace is the better guide.
Summary · one long page
Share the summary
The seven sections on one scrolling page, made to read on a phone. It links back to this page and the full study. Free to share.
For print: A3 version (PDF).
Full study · 40 slides
Read the full study
Every exhibit behind the summary: the census of 518 cinemas, the 36-country income tests, producers and genres, the money in a ticket, streaming, four paths to 2030 and 59 graded sources. Leave your email and it opens on this page.
Thank you. The full study is open below. Tap a slide to view it full screen.
- 1-3Cover, summary and how to read
- 4-61 · How the industry works
- 7-182 · Indonesia today: screens, chains, tickets
- 19-243 · The economics: margins, break-even, policy, streaming
- 25-294 · Indonesia against 36 countries
- 30-345 · The gap in numbers, and the prize to 2030
- 35-40Back matter: assumptions, data gaps, counter-case, sources
Arrow keys or swipe to move. On a phone, turn sideways and use full screen. Each slide has its own link: copy the address bar to share it.
All 40 slide headlines, by section
Cover, summary and how to read · slides 1 to 3
1 · How the industry works · slides 4 to 6
- 4Three kinds of company bring a film to a screen: producers make it, distributors sell it, and a few chains own the screens
- 5A Rp46,000 ticket splits three ways: about Rp4,200 to the city, Rp20,900 to the cinema and Rp20,900 to the producer side
- 6Indonesia publishes no official box office: the ministry counts local films, private trackers estimate the total, an industry body counts screens
2 · Indonesia today: screens, chains, tickets · slides 7 to 18
- 7Indonesia in 2025: 2,375 screens in 496 cinemas, and 80 million tickets sold for 201 Indonesian films
- 8Indonesia had more screens per person in the early 1990s than today: 2,853 fell to 676 by 2002, and the rebuild has reached 8.4 per million
- 9170 of 514 regencies and cities have a cinema, covering 62% of people; Java is 74 to 100% covered, NTB and NTT about 10%
- 10344 regencies with 109 million people have no cinema; the 20 largest could fill about 215 to 380 screens at the national rate
- 11Cinema XXI owns 59% of screens and sells about 69% of tickets; fifteen other chains and some independents share the rest
- 12Tickets to Indonesian films rose from 16 million in 2015 to 80 million in 2024, then held level in 2025 on 201 films
- 13In 2025 two films took a quarter of local tickets; the median film sold 100,000, below a cheap horror film’s break-even
- 14Local films took about a third of tickets in 2019 and two thirds in 2025, as imports fell from over 100 million tickets to about 41 million
- 15Horror supplies the volume, with 26 to 61% of top-30 tickets since 2017 and 90 of 201 releases in 2025; comedy makes the biggest hits
- 16The ten biggest imports grossed US$166 million in Indonesia in 2019 and US$49 to 62 million in 2024 and 2025, about a third as much
- 17MD Pictures sold 74 million tickets from 87 films in 2015 to 2025 and Falcon 59 million from 68; Hitmaker took 10 of 18 past a million
- 18About 110 to 140 companies release a film each year, three quarters of them only one; co-productions grew from a fifth to two fifths or more
3 · The economics: margins, break-even, policy, streaming · slides 19 to 24
- 19Cinema XXI earns Rp5.9 trillion a year at a 31% EBITDA margin, pays out more than its profit, and adds fewer screens each year
- 20A Rp5 billion film needs about 270,000 viewers to break even at Rp18,000 net a ticket; in 2025 three in ten releases got there
- 21Policy opened the market to foreign owners and capped the ticket tax at 10%, but funds neither films nor screens
- 22Streaming is the second screen: 27 million paid subscriptions, and Indonesian titles take 30% of Southeast Asia’s paid streaming viewing
- 23Paid streaming subscriptions rose from 21 to 27 million in 2023 to 2025 and cinema tickets rose too; hits reach streaming after 3 to 9 months
- 24Korea and India lost 56% and 43% of cinema visits since 2019 after steep price rises and short windows; Indonesia shows neither
4 · Indonesia against 36 countries · slides 25 to 29
- 25Indonesia has 8.4 screens per million people: a quarter of Malaysia’s, half of Thailand’s, and below Vietnam and the Philippines
- 26Indonesians buy 0.44 tickets a year each, fewer than Thais or Vietnamese, yet each screen sells 53,000 a year, second only to India
- 27At Indonesia’s income other countries have about 18 screens per million; Indonesia has 8.4, and Thailand and Malaysia also sit below the line
- 28Tickets per person sit close to the income line: Indonesians go to the cinema about as often as their income predicts, on half the screens
- 29Vietnam went from 90 screens to 1,200 in a decade, Korea doubled to 3,300 and Thailand reached 1,300; Indonesia added about 3 to 4% a year since 2019
5 · The gap in numbers, and the prize to 2030 · slides 30 to 34
- 30Six measures of the gap: 8.4 screens per million, 53,000 tickets per screen, 0.44 tickets per person, and one chain with 59% of screens
- 31Five public claims tested: Indonesia is short of screens but not by 10,000, the 2025 record is a tie, and streaming has not hurt cinema yet
- 32Four paths to 31 December 2030 give 81 to 200 million tickets a year; only a build-out to 15 screens per million reaches 200 million
- 33At 200 million tickets a year, spending at the cinema rises from Rp9 trillion to Rp14 trillion, still under 0.1% of GDP
- 34Eight dated signposts will show which path Indonesia is on, starting with Cinema XXI’s screen count each quarter
Back matter: assumptions, data gaps, counter-case, sources · slides 35 to 40
- 35Assumptions and parameters (Assumption_Register sheet of the study workbook)
- 36What we could not find, where sources conflict, and what the next update should pull
- 37The strongest case against our reading: tickets per screen may be overstated, and new screens outside big malls may not pay
- 38Sources (full list with grades and as-of dates: Sources sheet of the study workbook)
- 39Terms used in this study, in plain words
- 40Important information and disclaimer
Questions
Indonesia’s cinemas: common questions
Does Indonesia have too few cinemas?
Yes, by international standards. Indonesia has 8.4 screens per million people; countries at its income have about 18. The screens it has are full: each sells about 53,000 tickets a year, second only to India among the countries compared. Indonesians buy about as many tickets as their income predicts, so the shortage is in screens, not viewers.
How many cinema screens does Indonesia have?
2,375 screens in 496 cinemas, according to Badan Perfilman Indonesia’s statement to parliament in November 2025. Cinema XXI owns about 59% of screens and sells about 69% of tickets.
Where are Indonesia’s cinemas?
Mostly in Java’s malls. 170 of 514 regencies and cities have a cinema, covering 62% of people. The other 344, home to 109 million people, have none. Java is 74 to 100% covered; NTB and NTT about 10%; Aceh has no cinema.
Did 2025 set a record for Indonesian films?
Not clearly. Tickets to Indonesian films were 80.27 million in 2025 against 80.21 million in 2024, a 0.1% difference the count cannot separate. Two films took 26% of local tickets, and the median film sold about 100,000.
Is streaming taking the cinema audience?
Not so far. Paid streaming subscriptions rose from 21 to 27 million in 2023 to 2025 while cinema tickets rose too, and hits reach streaming three to nine months after release. Korea and India lost 56% and 43% of cinema visits after steep price rises and short windows; Indonesia shows neither. Confidence: moderate.
What would a cinema build-out cost, and what would it be worth?
Reaching 15 screens per million by 31 December 2030 takes about 2,065 more screens and Rp10 to 17 trillion of capital. It would mean about 200 million tickets a year, against 126 million in 2024, and spending at the cinema of about Rp14.4 trillion a year, still under 0.1% of GDP. No probability is assigned to any scenario.
Who are Indonesia’s biggest film producers?
From 2015 to 2025, MD Pictures sold 73.5 million tickets from 87 films and Falcon Pictures 59.4 million from 68. Hitmaker Studios had the best hit rate: 10 of 18 films passed a million tickets. About 110 to 140 companies release a film each year, three quarters of them only one.
How confident is the study, and what would change its view?
Moderate overall. The view would change if audited totals matched MPA’s box office, 25% below Cinepoint’s; if new regency cinemas kept closing; or if hits reached streaming inside three months while local-film tickets fell below 75 million in 2026.
Notes by section
How each number is built
Short versions of the working. The methodology note has the parameters, assumptions and change log; every source is on the sources page.
- Too few screens
Screens per million = 2,375 screens (BPI, Nov 2025) ÷ 283.5 million people (WDI 2024) = 8.4. Income line: semi-log fit of screens per million on GDP per person (PPP) across 36 countries, R² 0.58; predicted 18.5 at Indonesia’s $14,500. Tickets per screen = 126.2 million (tracker, 2024) ÷ 2,375 = 53,100.
- Where the cinemas are
Sulco census of 518 cinema sites, 29 to 30 October 2026, from Cinema XXI and CGV location lists, chain tables and showtime listings for independents; sites without showtimes treated as closed. Each site matched to one of 514 regencies and cities; populations BPS 2025.
- Who buys tickets
Tickets to Indonesian films: Kemenbud, 80.27 million in 2025. All tickets: private trackers (Comscore to 2019, Bicara Box Office 2022 to 2024); 2025 about 121 million is one industry estimate (grade C, low confidence). Genre shares: top 30 local titles by tickets each year.
- The money
Ticket Rp46,057 (Cinema XXI FY2025 average). City tax 10% of the net price; the net splits 50:50 between cinema and producer side by convention; distributor fee 12.5% (Sulco estimate). Break-even: Rp5 billion ÷ about Rp18,000 producer net a ticket ≈ 270,000 tickets.
- What a build-out is worth
Scenarios grow population 0.8% a year to 2030. A: screens +2.5% a year. B: 15 screens per million (4,440 screens). C: 30,000 tickets per screen. D: tickets per screen 20% lower. Box office = tickets × Rp46,057. Capital Rp5 to 8 billion a screen.
- Claims tested
“10,000 screens”: Indonesia’s income line × 284.4 million people ≈ 5,300 screens. “Record”: Kemenbud 80.27m (2025) vs 80.21m (2024). “6,600 screens”: no primary source found; archival series gives 2,853 in the early 1990s.
- What would change our view
MPA puts 2024 box office at US$294m, 25% below Cinepoint’s US$392m; at MPA’s level each screen sells about 40,000 tickets. Thresholds for the signposts are Sulco judgements tied to the scenario arithmetic.
Glossary
- Screen
- One auditorium with one projector. A multiplex with six halls is one cinema (site) and six screens.
- Admissions
- Tickets sold. “Tickets to Indonesian films” counts only local films.
- Screens per million
- Screens divided by population in millions. 8.4 means one screen for every 119,000 people.
- Regency and city
- Indonesia’s 514 local-government areas (kabupaten and kota) below the 38 provinces.
- Covered
- A regency or city with at least one cinema.
- Tracker
- A private service that estimates total admissions where there is no official count (Cinepoint, Bicara Box Office).
- Entertainment tax (PBJT)
- A city or regency tax on the ticket, capped at 10% since 2024.
- BPI
- Badan Perfilman Indonesia, the national film body
- Kemenbud
- Ministry of Culture
- Window
- The time between a film’s cinema release and its streaming release.
- Paid streaming (SVOD)
- Subscription video on demand, such as Netflix or Vidio.
- EBITDA
- Profit before interest, tax, depreciation and amortisation.
Disclosures. Version 1.0; corrections, if any, are listed in the change log on the method page. Prepared by Ade S for Sulco Research, an independent research publisher, for information and discussion only. Not investment, legal, tax or policy advice, and not a recommendation to buy, sell or hold any security, including shares of Cinema XXI (CNMA), CGV (BLTZ), MD Entertainment (FILM) or MNC/RAAM. Regulatory status: Sulco Research is not licensed or registered with OJK or any other regulator as an investment adviser. The author may hold positions in securities named in this study and may trade them; views are the author’s own. Figures come from public sources believed reliable but not independently verified; estimates and scenarios are illustrative and may differ materially from outcomes. AI tools were used in research and drafting; figures were checked against the study workbook before publication. Data to 30 October 2026. Corrections are logged in the methodology note. Methodology · Sources